
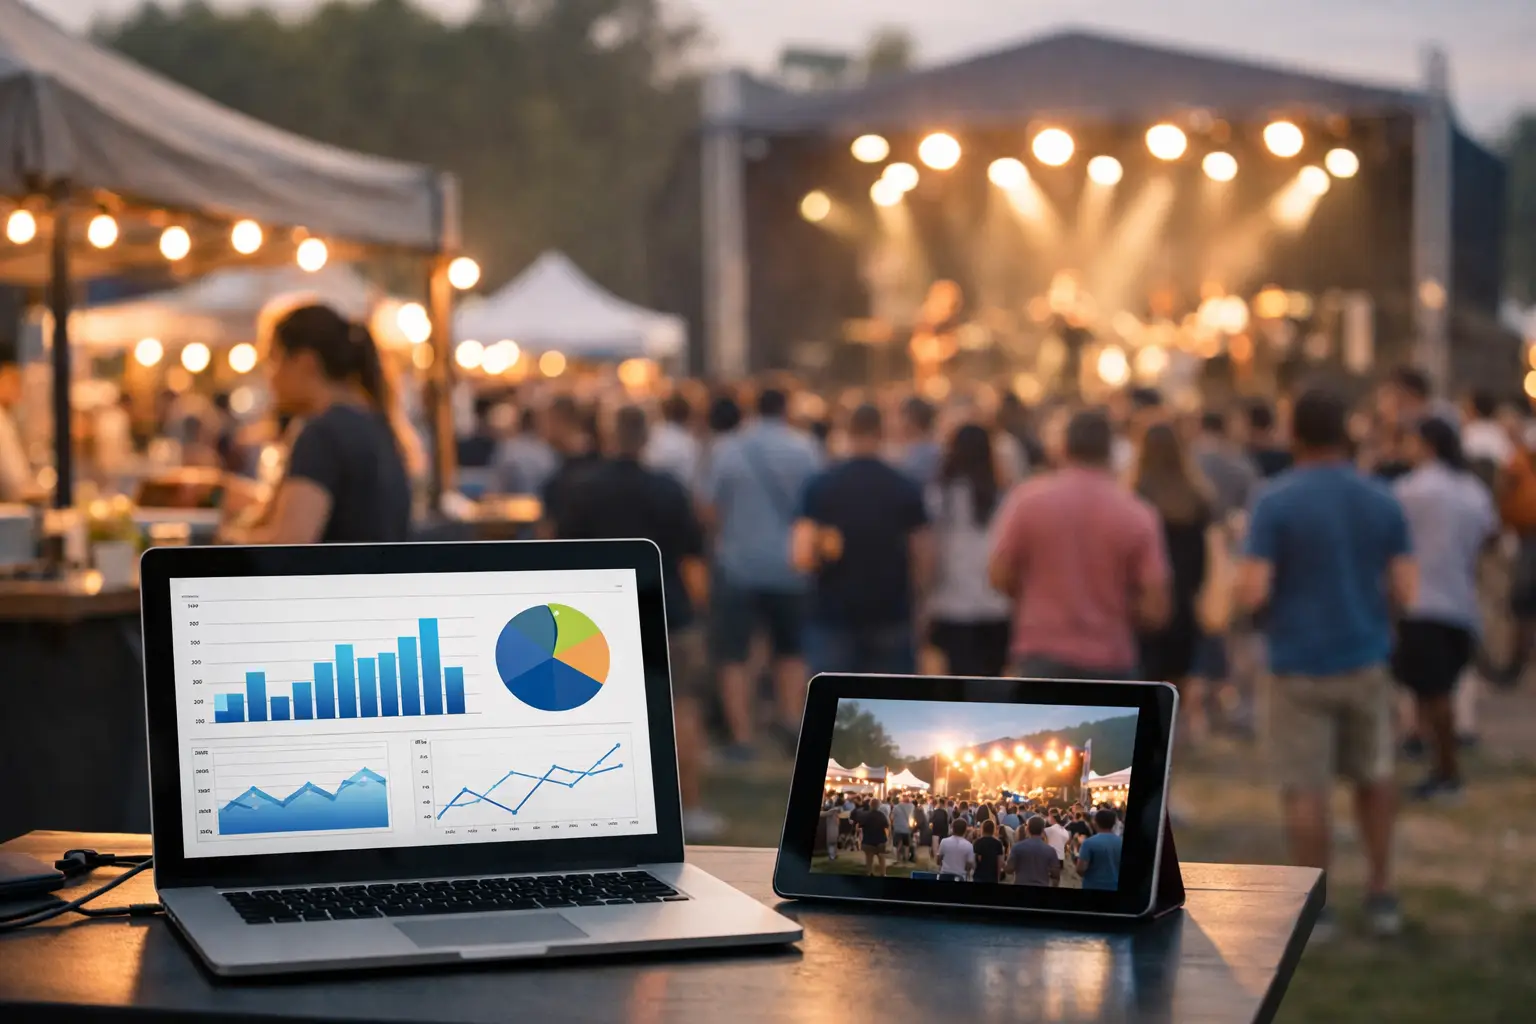
A packed market can still be a disappointing trading day. If queues form at one end of the grounds while great stalls sit quiet at the other, or a popular food operator sells out before lunch, the problem is not attendance alone. Vendor analytics for live events gives organisers and stallholders the evidence to see what happened, act while it still matters, and build a stronger next event.
For a farmers market, craft fair, gaming convention or car show, the best decisions are rarely based on total sales alone. You need to understand which vendors drew demand, where attendees spent time, how trading changed across the day, and whether the event layout helped or hindered people from buying.
What vendor analytics should show you
Vendor analytics connects event-day activity with the decisions that shape revenue and experience. At its best, it brings together point-of-sale data, vendor applications, stall locations, attendance patterns and vendor feedback in one operational view.
For vendors, that means seeing more than the final takings figure. A coffee van may learn that its busiest hour is 9.30 to 10.30 am, but its average order value rises after midday when customers add food. A handmade jewellery seller may find that sales are steady, yet card transactions spike when they are placed near a fashion stall rather than beside low-cost accessories. Those patterns guide stock, staffing, pricing and future applications.
For organisers, the view is wider. You can compare categories, identify demand gaps, assess site zones and understand whether the vendor mix matches the audience you attracted. A strong event is not simply one where every site is sold. It is one where attendees can discover a useful, varied and commercially healthy mix of stalls.
The metrics that matter on the ground
Start with metrics that have a clear operational use. Gross sales and transaction count show volume, but average transaction value explains whether customers are making quick purchases or shopping with intent. Sales by hour reveal staffing pressure and stock risk. Payment method data helps vendors prepare for the way customers actually want to pay.
Category performance is equally valuable for organisers. If artisan food consistently outperforms other categories, that does not automatically mean you should add ten more food stalls. It may signal a broader opportunity, or it may show that a small number of standout operators are doing the heavy lifting. Look at performance alongside vendor count, location, trading hours and product range before changing the mix.
Other useful signals include repeat attendance, lead captures, loyalty activity, pre-event storefront visits and favourites. These measures matter because many live-event sales start before gates open. An attendee who saves a vendor, checks their range, then finds them quickly on site is more likely to buy than someone wandering without a plan.
Turn vendor analytics for live events into better layouts
A site plan is a commercial tool, not just a map. It controls foot traffic, dwell time, visibility, access and the energy of the event. Analytics can show where people naturally move, where they stop, and which areas need a reason to visit.
Look at sales and transaction data by location, then compare it against the type of vendor in each space. A lower-performing zone may be a poor location, but it could also be a category mismatch. Placing a quiet browsing-based seller near a loud stage or a busy food queue may reduce the time customers have to engage. Conversely, a high-turnover vendor can help activate a quieter lane and pull visitors through the site.
Do not treat the highest-selling stalls as automatic anchors every time. High demand vendors can create congestion if they are placed at a narrow entrance, beside amenities or in the only route to parking. For mobile food operators, queue length, service speed and access to power or waste facilities need to be considered alongside sales. A stall that sells well while blocking the footpath can reduce the total value of the event.
Test layout changes deliberately. Move a category, change the position of a feature vendor, create a clearer discovery route or add signage to a quieter section. Then compare results across similar event days. Weather, school holidays and local competing events can affect sales, so one Saturday rarely tells the full story.
Give vendors useful data, not just a report card
Independent sellers are busy. They are loading a ute before sunrise, setting up displays, serving customers and packing down after a long day. The analytics they receive needs to answer practical questions quickly.
A useful vendor view shows when sales occurred, what sold, how customers paid and how results compare with their own recent events. It should also help them understand the next action: bring more of a fast-moving line, roster an extra person for the rush, adjust bundle pricing, or apply for a different site position next time.
Avoid presenting rankings without context. A vendor in a premium corner spot, a vendor with a large social following and a first-time stallholder testing a new product are not operating under the same conditions. Comparison can be motivating, but it should support fair decisions rather than create a misleading leaderboard.
For organisers, sharing clear event-level insights builds trust. Vendors are more likely to return when they can see how attendance, promotion, layout and operational choices are being improved. It also makes vendor recruitment more targeted. Instead of broadly filling vacant sites, you can seek the categories attendees want and the operators that fit the event’s trading pattern.
Use live data to manage the day, not only review it later
Post-event reports are useful, but the biggest operational gains often happen during the event. If transaction data shows a sudden rush around lunch, an organiser can redirect foot traffic, check whether food vendors need support or use announcements to promote quieter areas. If a payment issue appears across several stalls, the team can respond before lost sales become a vendor complaint.
Real-time visibility also improves incident management. A queue building near an emergency access point, a vendor unable to process payments, or a site that is unexpectedly underperforming can be logged and acted on by the right person. This is where connected tools matter: site planning, vendor operations and payment data should inform the same event-day decisions.
There is a trade-off. Too much live data can distract a small operations team from the people directly in front of them. Set a short list of event-day indicators to monitor, such as transaction volume, payment exceptions, queue-prone areas and incident status. Leave deeper category analysis and vendor comparisons for the post-event review.
Build a repeatable review after every event
The most valuable analytics process is consistent. After each event, review performance while the team and vendors still remember what happened on site. Pair the numbers with observations: Was rain affecting the western end? Did a road closure change arrival patterns? Was a popular vendor short staffed? Did the entertainment schedule shift customer movement?
A practical review can focus on four decisions: which vendors to invite back, which categories to grow or rebalance, what to change in the site plan, and what vendors need to prepare differently next time. Keep a record of the decision and the reason behind it. Over a season, this becomes a valuable operating history rather than a collection of disconnected spreadsheets.
Platforms such as Evntle are built around this connected view, bringing vendor operations, event-day selling and discovery activity into the same ecosystem. That makes it easier to move from a sales figure to a decision without chasing information across multiple tools.
Better data creates better event communities
Vendor analytics should never reduce an event to a spreadsheet. Markets, fairs and conventions work because people discover new businesses, meet their community and return for the atmosphere as much as the purchase. The role of data is to protect that experience by making the commercial foundations stronger.
When organisers use evidence to create a better vendor mix, clearer site flow and more responsive event operations, vendors get a fairer opportunity to trade. Attendees find more reasons to stay, explore and come back. Start with the decisions that affect the next event day, measure the outcome, and let each event make the one after it more useful for everyone.
📖 Related
See the KDS and POS in action — try the live demo or create a free account.