
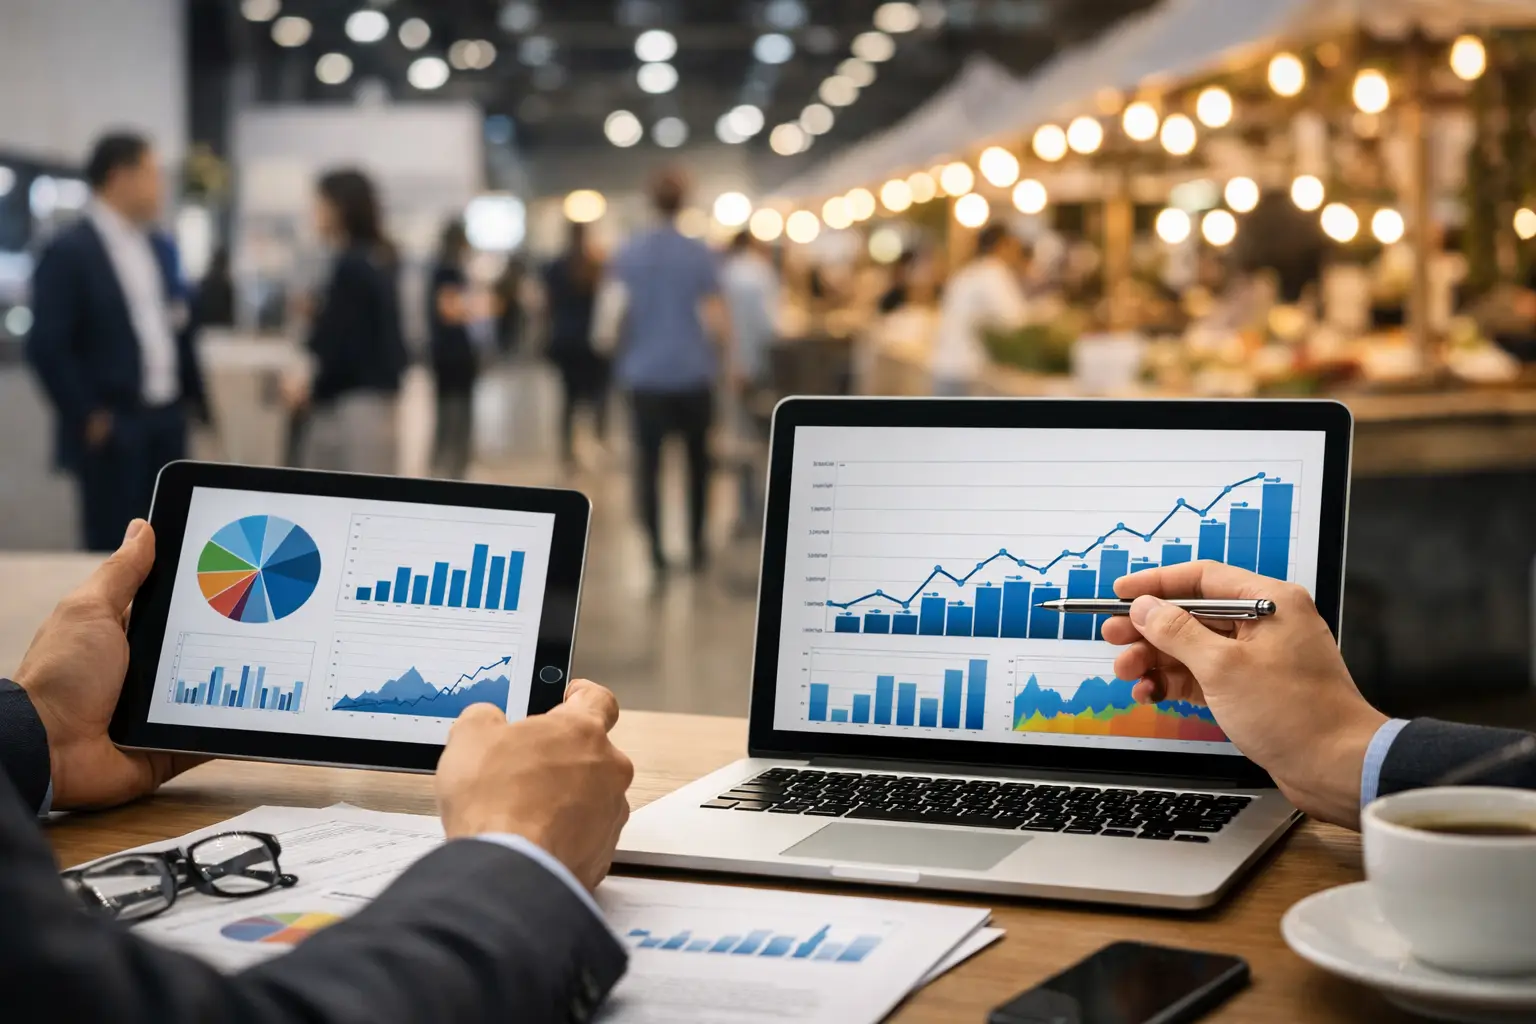
A busy market can look like a success while quietly leaving money on the table. Queues build at one food stall, great vendors are tucked into low-traffic corners, and attendees leave without discovering half the businesses they came to see. Event analytics gives organisers and vendors a clearer view of what actually happened, so the next event can run better, sell better and bring people back.
For live events, the useful data is not just a final sales total. It is the pattern behind the total: when people arrived, where they spent, which vendors drew attention, what caused bottlenecks and whether attendees found enough reason to return.
Event analytics should answer operational questions
The most useful reports begin before an event, not after it. Rather than collecting every possible number, start with a decision your team needs to make. A Saturday craft market may need to know whether its new layout improved foot traffic. A food festival may need to understand why transaction volume dropped after 1 pm. A gaming convention may be deciding which vendor categories deserve more floor space next year.
That focus changes analytics from a dashboard that gets glanced at once into an operating tool. It helps organisers plan sites, manage vendor mixes and market future dates with evidence. For vendors, it shows whether an event was worth the stall fee, travel time, stock commitment and early-morning setup.
The right question also depends on the event type. A monthly farmers market needs to measure repeat attendance and category balance over time. A one-off car show may care more about arrival peaks, exhibitor engagement and merchandise sales on the day. There is no universal benchmark that makes an event healthy. Context matters.
Track the full event journey, not only checkout
Sales data is essential, but it only captures the last moment of a customer journey. Someone may discover an event through a listing, browse a vendor’s storefront on their mobile, save a favourite, visit the stall and make a purchase days later. Another person may arrive, see a queue, and decide not to buy at all.
A complete view connects pre-event discovery, event-day operations and post-event follow-up. That does not mean turning every stallholder into a data analyst. It means recording the few signals that explain movement through the event.
Before gates open, look at vendor applications, category demand, listing views, saves and attendee registrations where relevant. These figures indicate what people expect from the event and where your promotional effort is landing. If a group of vintage sellers gets strong profile views but weak applications, the issue might be an unclear vendor offer rather than low interest.
During the event, sales by time, payment method, basket value and location reveal how the site is performing in real conditions. Pair those figures with practical operational records: queue incidents, weather changes, site access issues, power faults or a late vendor arrival. Numbers without context can point teams in the wrong direction.
Afterwards, track reviews, favourites, repeat visits, vendor rebookings and attendee engagement with future listings. A strong event is not only one that fills a site plan. It builds enough value for vendors and attendees to return.
The metrics that matter on market day
A small set of connected measures is more useful than a screen crowded with charts. Organisers should be able to see these figures quickly and understand what action they support.
Total sales and sales by hour show both commercial performance and pressure points. A high daily total can still hide a difficult trading window. If most transactions happen in a 90-minute rush, more entry capacity, better queue management or staggered programming may improve the experience.
Average transaction value helps vendors assess what customers are buying, not just how many customers arrive. A lower average may be fine if transaction volume rises substantially. For a seller with limited stock or high transaction fees, however, a busy day with small baskets may require a different product bundle, upsell or pricing approach.
Vendor performance by category and location helps organisers make better site-planning decisions. This should never be used as a blunt ranking system. A coffee stall near the entrance and a ceramic maker in a quieter aisle operate under different conditions. Compare similar categories, consider site placement, and use the result to improve layout rather than punish vendors for factors outside their control.
Attendance and arrival patterns show when people are entering, lingering and leaving. If families arrive early but food sales surge late, programming, signage and vendor placement can be adjusted around those behaviours. If an advertised feature pulls a sharp arrival spike, gates, parking and entry staff need to be ready for it.
Conversion from discovery to visit or sale connects marketing activity to event outcomes. Views and social attention are useful, but they are not the end goal. Look for signals that people moved from discovering the event or vendor to saving, attending, enquiring or buying.
Make data capture easy for vendors and staff
Event analytics breaks down when data entry competes with serving customers. A food operator should not have to stop a lunch rush to update a spreadsheet. A market manager should not be chasing stallholders for paper tally sheets while packing down marquees.
The best approach is to capture information through the workflows people already use. Point-of-sale transactions can record sales timing and basket values. Vendor applications can surface category, product and trading information. Digital site plans can connect a vendor to a physical location. Lead capture can record genuine customer interest without requiring manual follow-up lists.
Operational incidents deserve the same treatment. If a power lead fails, a queue blocks an access point or wet weather shifts foot traffic, log it when it happens. A short, time-stamped note can explain a sales dip far better than a report assembled from memory on Monday morning.
This is where an integrated event platform has an advantage over disconnected tools. When organiser operations, vendor activity, payments and attendee discovery sit in separate systems, reporting becomes a reconciliation job. Evntle brings those event workflows closer together, making it easier to see the commercial and operational picture without adding another layer of admin.
Turn reports into changes people can feel
The value of analytics is realised in the next site plan, vendor briefing or campaign, not in the report itself. After each event, set aside a short review while details are still fresh. Bring together the data with observations from event staff, vendors and attendees.
If sales peaked near one entrance, consider whether the layout encouraged people to turn around before exploring the full site. If a popular vendor created a persistent queue, assess whether they need more frontage, a different position or clearer pre-order options. If certain categories generated attention but weak sales, ask vendors whether product range, price points or event audience fit played a role.
Avoid changing everything after one event. Weather, public holidays, competing events and local conditions can distort a single day. Look for a pattern across several comparable events before making major category, pricing or layout decisions. The exception is a clear safety or access issue, which should be addressed immediately regardless of the numbers.
It also helps to share relevant insights with vendors. They do not need every organiser metric, but they benefit from practical information such as peak trading times, attendee interests and category demand. Better-prepared vendors create stronger stalls, and stronger stalls make the event more attractive to attendees.
Build trust around event data
People will use data more willingly when they understand why it is collected and how it helps them. Be clear with vendors about what reporting is available, what information is shared and what remains private. Be equally transparent with attendees when collecting contact details, preferences or loyalty activity.
Good governance is commercial common sense. Collect what you can act on, protect it properly and avoid treating attendee behaviour as a commodity. A vendor directory, event listing and loyalty feature can make discovery more relevant, but only when people trust the platform behind them.
The goal is not to make live events feel overly measured. It is to remove the guesswork that creates long queues, poor layouts, wasted stock and forgettable experiences. When each event leaves behind a clearer picture of what people valued, the next one has a better chance of becoming a local favourite.
📖 Related
See the KDS and POS in action — try the live demo or create a free account.